Return to Medial Topics Home Page
HIGH CARBOHYDRATE - HIGH FIBER DIET
© 20 lean, type II diabetics; FBS ³ 200 despite insulin
·
Standard
43% carbohydrate diet for 7 days
·
Experimental
79% carbohydrate for 16 days
|
|
Control |
Experimental |
||
|
|
gm/day |
%
cal/day |
gm/day |
%
cal/day |
|
Protein |
92 |
20
% |
98 |
21
% |
|
Carbohydrate |
191 |
43
% |
314 |
70
% |
|
Simple |
79 |
|
91 |
|
|
Complex |
112 |
|
223 |
|
|
Fat,
total |
74 |
37
% |
18 |
9
% |
|
Saturated |
26 |
|
5 |
|
|
Unsaturated |
48 |
|
13 |
|
|
Cholesterol |
.48 |
|
.065 |
|
|
Plant
Fiber |
26 |
|
65 |
|
|
Insoluble |
16 |
|
53 |
|
|
Soluble |
10 |
|
12 |
|
|
¨ Effect on insulin and glucose levels |
||||||
|
|
Blood
Sugar |
|||||
|
Insulin Dose |
Fasting |
3
Hour |
||||
|
|
Ctrl |
HPF |
Ctrl |
HPF |
Ctrl |
HPF |
|
15-20 |
17 |
0.2 |
165 |
128 |
142 |
140 |
|
22-34 |
30 |
12 |
178 |
168 |
209 |
224 |
|
40-57 |
48 |
42 |
180 |
167 |
- |
- |
|
Total |
26 |
11 |
164 |
152 |
189 |
172 |
|
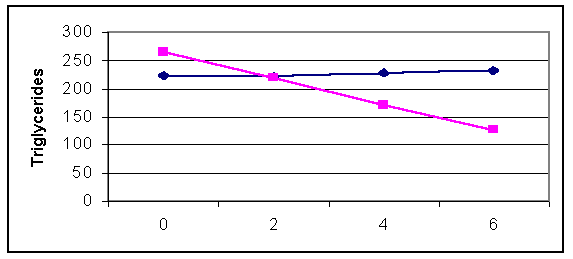
¨ Effect on lipid values |
||||
|
|
Cholesterol |
Triglycerides |
||
|
|
Control |
HPF |
Control |
HPF |
|
15-20 |
197 |
148 |
144 |
13 |
|
22-34 |
225 |
152 |
149 |
140 |
|
40-57 |
187 |
135 |
96 |
89 |
|
Total |
206 |
147 |
131 |
128 |
MODERATE
CARBOHYDRATE RESTRICTION
©
28 Type
II diabetics
¨
All on
60% carbohydrate, 20% protein, 30% fat diet
¨
19 on
sulfonylurea drugs
¨
None
achieving adequate sugar control
¨
All with
documented insulin resistance
·
Eight
weeks of moderate carbohydrate restriction
¨ Calories based on ideal body weight
¨ Alcohol eliminated
¨
25%
carbs; 85% complex and 15% simple
¨
45% protein
¨
30% fat
·
Taper out
sulfonylureas while on the experimental diet
·
Then
switch to the ADA diet for 12 weeks
|
© Patients
previously on drug therapy |
|
|||||
|
|
Baseline |
25%
Carb |
60%
Carb |
|
||
|
FBS |
258 |
192 |
183 |
|
||
|
HbA1c |
9.9 |
8.1 |
8.9 |
|
||
|
Weight |
167 |
164 |
169 |
|
||
|
© Patients previously on diet alone |
||||||
|
|
Baseline |
25%
Carb |
60%
Carb |
|
||
|
FBS |
261 |
172 |
231 |
|
||
|
HbA1c |
9.2 |
7.8 |
9.0 |
|
||
|
Weight |
180 |
178 |
180 |
|
||
THE GLYCEMIC INDEX
·
Developed
by Dr. David Jenkins in 1981
·
Rise in
glucose & insulin following intake of a food
·
100 -
rise after ingestion of glucose
|
Food |
Index |
Food |
Index |
|
Sugars |
|
Grains |
|
|
Glucose |
100 |
Puffed
rice |
95 |
|
Maltose |
105 |
Cornflakes |
80 |
|
Honey |
75 |
Whole
gr brd |
72 |
|
Sucrose |
69 |
Rice |
70 |
|
Fructose |
20 |
White
bread |
69 |
|
Fruits |
|
Wheat
cereal |
67 |
|
Raisins |
64 |
Corn |
59 |
|
Bananas |
62 |
Bran
cereal |
51 |
|
Orange
juice |
46 |
Oatmeal |
49 |
|
Oranges |
40 |
Pasta |
45 |
|
Apples |
39 |
Legumes |
|
|
Vegetables |
|
Peas |
39 |
|
Potato,
baked |
98 |
Beans |
31 |
|
Potato,
boiled |
70 |
Lentils |
29 |
|
Beets |
64 |
Misc. |
|
|
Carrot,
cooked |
36 |
Ice
cream |
36 |
|
Carrot,
raw |
31 |
Milk |
34 |
|
|
|
Sausage |
28 |
|
|
|
Nuts |
13 |
PLANT FIBER & BLOOD SUGAR
CONTROL
Fiber:
The portion of plants that is composed of complex
carbohydrate polymers of simple sugars
·
Soluble
¨ Gel-forming substances, such as pectin, gum,
& mucilage
¨ Efficiently degraded by intestinal bacteria
¨ Promote metabolic health
¨ Beans, legumes, oat bran, nuts, apples,
pears,
psyllium seed husks, and most vegetables
·
Insoluble
¨ Structural plant fibers that pass through the
GI tract
unchanged,
such as lignin, cellulose, and hemicellulose
¨Promote intestinal health
Properties
of Soluble Fiber:
· Decreases gastric emptying rate
¨ decreases appetite
¨ delay glucose absorption
·
Binds to
and wastes dietary fat
· Binds to and wastes bile acids
PSYLLIUM FIBER & BLOOD SUGAR CONTROL
·
Soluble
fiber should help with sugar & lipid control
·
Metamucil-
5 grams of Plantago psyllium soluble fiber
Will Metamucil help our
diabetic patients?
©
125
middle aged type II diabetic patients
· 92% on insulin, 8% on sulfonylurea
· Standard diet for six weeks: 50%carbohydrate
300 calories of protein
rest polyunsaturated fats
·
Metamucil
or placebo t.i.d. before meals ´
6 weeks
·
Then
crossover to the other treatment
·
Diet and
drug therapy maintained
·
Randomized,
double blind protocol
©
Well tolerated - compliance excellent
·
93% psyllium & 96% placebo doses taken
·
Only 2/62 psyllium patients dropped out
© Psyllium effects on Fasting Blood Sugar & LIPIDS
|
|
Placebo |
Psyllium |
|
Wk
0 |
198 |
194 |
|
Wk
6 |
180 |
175 |
|
Wk
12 |
187 |
140 |
|
%
D |
+ 4% |
- 20% |
|
|
Placebo |
Psyllium |
||||
|
|
Wk
0 |
Wk
12 |
%
D |
Wk
0 |
Wk
12 |
%
D |
|
Chol |
232 |
215 |
- 7% |
221 |
195 |
- 12% |
|
LDL |
157 |
140 |
- 11% |
146 |
118 |
- 20% |
|
Trigs |
200 |
184 |
- 8% |
186 |
137 |
- 26% |
|
HDL |
32 |
35 |
+9% |
35 |
51 |
+46% |
FENUGREEK
· Trigonella
fenum-graecum, common spice used in cooking
· White
flowered plant, member of the Pea family
· Originated
in Northern Africa
· Historically used to treat DM, fevers, and indigestion
· Found in King Tut’s tomb
·
Water
soluble fiber, galactomannans
·
Steroidal
saponins
¨
increase
and/or enhance insulin receptors
¨
increase
bile acid metabolism
Will
fenugreek help with blood sugar control?
FENUGREEK
©
In type I
diabetics
¨
50 gm b.i.d. in flatbread ® ¯
gluc, chol, LDL, & trigs
©
In type
II diabetics
¨
25 gm/day
® ¯
FBS and diabetic symptoms
¨
15 gm
blunted post-meal rise in glucose level
¨
12.5 gm
in soup b.i.d. ® ¯
LDL & trigs - HDL ed
IRON REMOVAL REMOVES DIABETES
·
Iron
excess is associated with coronary heart disease
·
Excess
iron may also
§
Compromise
peripheral glucose utilization
§
Damage
the pancreatic b cells
·
Heart
Disease and DM occur in Hemochromatosis
·
The DM of
Hemochromatosis responds to phlebotomy
·
5%
diabetics have high ferritins >
400(m) > 300(w)
Will
DM respond to iron removal?
©
Measure Ferritin levels in 18 DM II patients
§
9 within
normal range of 21-330 mg/L
§
9 with
elevated values
·
10 mg/kg IV Desferroxamine twice a week
¨ until Ferritin normalizes - 16 tnts over 8
weeks
¨
12 tnts over 6 weeks in control group
Results
|
|
Ferritin |
Glucose |
HbA1c |
Chol |
Trigs |
|||||
|
|
Pre |
Post |
Pre |
Post |
Pre |
Post |
Pre |
Post |
Pre |
Post |
|
Controls |
197 |
141 |
317 |
301 |
8.6 |
8.5 |
211 |
200 |
201 |
208 |
|
Ferritin |
595 |
275 |
258 |
150 |
8.2 |
5.8 |
262 |
218 |
414 |
215 |
|
nl
range |
2-330 |
68-131 |
4.0-6.0 |
120-250 |
34-142 |
|||||
Conclusions
1.
Iron overload plays a role in type II Diabetes
2.
Iron overload is relatively common in diabetics
2.
Iron chelation is safe
3.
Iron chelation in iron overloaded diabetic patients
ELEOTIN HERBAL TEA
·
Over 2000 herbs can lower sugar levels
¨
Some are toxic
¨
Single mechanism of action
·
In developing Eleotin
¨ Looked at multiple plants
¨
Utilized various combinations
¨
Tested extensively for toxicity
Platycodi Radix
Schizandrae Fructus
Capsella Bursa
Astragalus Membranaceus
Nycium Chinese
Dioscorea Japonica
Acanthopanaz
Sessiliflorum
·
Test in animals and humans
©
Study in animals - GK diabetic rat
·
Maturity
onset diabetes
·
Insulin
resistance
·
Impaired
insulin secretion
·
Model for
adult onset DM II
© Insulin binding in liver
|
|
|
|
© Glucosidase inhibitor - delays carb
absorption
|
|
© Increases pancreatic insulin secretion
|
|
|
Tnt |
Placebo |
Eleotin |
||||||
|
Mos. |
Glucose |
%
diabetic |
Glucose |
%
diabetic |
||||
|
0 |
381 |
90 |
387 |
90 |
||||
|
1 |
390 |
90 |
334 |
80 |
||||
|
2 |
403 |
90 |
271 |
70 |
||||
|
3 |
387 |
95 |
251 |
60 |
||||
|
4 |
393 |
95 |
231 |
50 |
||||
|
5 |
395 |
95 |
201 |
35 |
||||
|
6 |
389 |
95 |
175 |
25 |
||||
|
7 |
394 |
95 |
146 |
15 |
||||
|
|
|
|
|
|
||||
|
|
Prevention
of diabetes in GK rats
·
Begin Eleotin or placebo at 3 weeks of age
·
Follow sugar values
|
Age
in |
Placebo |
Eleotin |
||
|
weeks |
Glucose |
%
diabetic |
Glucose |
%
diabetic |
|
3 |
145 |
0 % |
147 |
0 % |
|
5 |
168 |
0 % |
156 |
0 % |
|
7 |
211 |
25 % |
165 |
5 % |
|
10 |
354 |
70 % |
168 |
10 % |
|
|
© Glucose lowering effects of Eleotin in humans
|
Pat.
|
Duration DM-yrs |
Duration
Tnt-mos |
Glucose
Pre |
Glucose
Post |
Insulin
Post |
|
P.T. |
15 |
6 |
469 |
210 |
Yes |
|
H.G. |
14 |
4 |
425 |
187 |
Yes |
|
J.S. |
13 |
8 |
417 |
132 |
No |
|
T.Y. |
12 |
7 |
406 |
162 |
Yes |
|
L.H. |
12 |
4 |
425 |
187 |
Yes |
|
B.H. |
11 |
3 |
380 |
132 |
No |
|
K.T. |
10 |
6 |
429 |
173 |
No |
|
O.P. |
9 |
6 |
425 |
168 |
No |
|
Y.S. |
7 |
6 |
398 |
180 |
No |
|
K.D. |
5 |
4 |
320 |
128 |
No |
© Glucose levels after stopping Eleotin
|
|
Glucose |
||
|
|
Pre-Eleotin |
Post-Eleotin |
3
mos out |
|
Y.S. |
398 |
180 |
183 |
|
K.T. |
429 |
173 |
170 |
|
K.D. |
320 |
128 |
134 |
|
O.P. |
425 |
168 |
186 |
|
B.H. |
380 |
132 |
134 |
|
J.S. |
417 |
132 |
137 |
|
L.H. |
396 |
178 |
175 |
|
Average |
338 |
156 |
160 |

© Factors predicting efficacy
·
Shorter duration of diabetes
·
Younger patient age
· Abstinence from alcohol
©
Guidelines for use
|
Disease
severity |
Effect
begins |
Decrease
dose |
|
Mild
<
3 yrs |
1-3
mos |
6
mos |
|
Mod
<
3 yrs |
3-6
mos |
1-2
yrs |
|
Severe
>
6 yrs |
6-12
mos |
several
yrs |
B
VITAMINS VS NEUROPATHY
¨
Peripheral nerve structure and function
¨
Production of serotonin and GABA in the brain
¨
Perception of pain by the brain
Water
soluble B vitamins are poorly absorbed, 4-6%
Benfotiamine,
a fat soluble Thiamine derivative
¨
Much
better absorption
¨
Higher
blood and tissue levels
Could
a Benfotiamine based oral B vitamin improve nerve function in humans with
diabetic neuropathy?
©
24 middle
age diabetic patients with stable neuropathy
·
Benfotiamine
90 mg, B6 90mg, B12 250 mcg or placebo
¨ Two q.i.d. ´
14 days in hospital, then
¨ One t.i.d.
´
10 weeks at home
·
At
baseline, 2 weeks, and 10 weeks, measure
¨ Nerve vibration threshold
¨
Nerve conduction velocity
¨
Lab studies
© Tolerance excellent - no side effects or
change in labs
|
© Vib Percep Wrist |
|||
|
|
W
0 |
W12 |
%
D |
|
Plac |
1.8 |
1.9 |
+
5 |
|
B
vit |
2.9 |
1.4 |
- 52 |
|
|
|
|
|
|
|
|
|
|
|
© Vib Percep Ankle |
|||
|
|
W 0 |
W12 |
% D |
|
Plac |
11.9 |
15.7 |
+
32 |
|
B vit |
17.0 |
12.0 |
-
42 |
|
© Nerve Cond Vel Leg |
|||
|
|
W 0 |
W12 |
% D |
|
Plac |
43.1 |
40.4 |
-
6 |
|
B vit |
40.2 |
41.3 |
+
2 |
LIPOIC
ACID
·
Blood
flow to the peripheral nervous system is compromised by oxidative stress
·
Oxidative
stress produces motor and sensory peripheral nerve dysfunction in diabetics
·
Antioxidants
protect against neuropathy in experimental diabetes
fat soluble
antioxidants work best
·
Lipoic
acid is a fat & water-soluble antioxidant
·
Lipoic
acid encourages regeneration of damaged nerves
Could
Lipoic acid, a potent, fat soluble antioxidant, improve nerve function and
reduce diabetic neuropathy symptoms in humans?
© The
ALADIN Study
Alpha
Lipoic Acid in Diabetic Neuropathy
·
260 type
II diabetics with symptomatic neuropathy
·
None on
antioxidants, B vitamins, or EFAs
·
Usual
diet and medication
·
22 IV
treatments over five weeks
¨
1200 mg LA
¨ 600 mg LA
¨ 100
mg LA ¨ Placebo
· Randomized, double blind, multicenter
protocol
|
© Effect on symptoms and tolerance to treatment |
||||
|
|
TSS |
MD
Rating |
Adv
Rxns |
Tolerance |
|
Placebo |
58% |
46% |
21% |
98% |
|
1200
mg |
71% |
62% |
33% |
83% |
|
600
mg |
82% |
76% |
18% |
95% |
|
100
mg |
65% |
53% |
14% |
93% |
CAYENNE PEPPER VS. NEUROPATHY
·
Capsacin
is the pungent principle of Cayenne spp.
·
Depletes
substance P and numbs sensory nerves
®Reduces
the sensation of pain
®Capsacin
cream helps relieve pain in post-herpetic neuralgia and post-mastectomy syndrome
Can capsacin cream reduce the pain of diabetic
neuropathy?
©
277 type
I and type II diabetics
·
0.075%
capsacin or placebo cream q.i.d. to painful areas
·
Analgesics
allowed for early treatment burning
·
All other
meds held constant
·
Evaluate
every 2 weeks over 8 weeks
· Measure the presence and severity of pain
¨
MD global
evaluation: (+3)
much better ®
(0)
no change ® (-2)
much worse
¨
Patient visual analog scale of pain intensity
¨ Visual analog scale of pain relief
·
Randomized,
double blind protocol; 12 centers involved
1st two weeks - ed burning due to capsacin; 9 dropped out
By 8 weeks
- significant ¯ in pain intensity and
significant
in MD evaluation
©
Patient
tolerance - Moderate
|
|
No. |
Pts |
Burn |
Cough |
Other |
Drop |
|
Capsacin-138 |
135 |
108 |
87 |
16 |
32 |
38 |
|
Placebo-139 |
49 |
41 |
23 |
2 |
24 |
20 |
|
©
% Improving |
||||||
|
|
|
|
|
|||
|
|
MD
scale |
¯ Intensity |
Pain
Relief |
|||
|
|
Wk
2 |
Wk
8 |
Wk
2 |
Wk
8 |
Wk
2 |
Wk
8 |
|
Placebo |
43 |
51 |
14 |
28 |
31 |
45 |
|
Capsacin |
57 |
71 |
17 |
40 |
36 |
60 |
FISH
OIL vs NEUROPATHY
·
Proven benefits in cardiovascular disease
· Fish oil increases the blood sugar in diabetics,
but fish oil with vitamin E does not
·
EFAs are involved in normal nerve function
©
21
diabetic patients with
¨
Painful neuropathy
¨
Vascular disease with absent foot pulses
·
600 mg purified EPA tid with meals ´
48 weeks
·
Monitor over the course of treatment
1.
Symptoms - coldness and numbness
2.
Vibratory perception threshold
3.
Lab values
4.
Cross sectional area of the Dorsalis Pedis artery
|
Change
in Vibratory Perception Threshold - mm |
||||
|
|
Before |
Fish Oil Supplementation |
||
|
|
0
wks |
12
wks |
24
wks |
48
wks |
|
Ankle
|
32 |
19 |
22 |
16 |
|
Wrist |
13 |
9.5 |
9.6 |
9.8 |
|
Change
in Dorsalis Pedis Artery |
|||||||||||
|
|
Before |
Fish Oil Supplementation |
|||||||||
|
|
0
wks |
12
wks |
24
wks |
48
wks |
|
||||||
|
Area(mm2)
|
2.5 |
3.4 |
3.3 |
3.9 |
|
||||||
|
Flow
Index |
17 |
25 |
34 |
46 |
|
||||||
|
Change
in Lab Parameters |
|||||||||||
|
|
Before |
Fish Oil Supplementation |
|||||||||
|
|
0
wks |
12
wks |
48
wks |
%
D |
|
||||||
|
%
EPA |
3.0 |
5.5 |
5.7 |
+ 90% |
|
||||||
|
Glucose |
138 |
147 |
166 |
+ 20% |
|
||||||
|
HbA1c |
7.3 |
7.3 |
7.6 |
+ 4% |
|
||||||
|
Trig
³ 150 |
263 |
175 |
214 |
- 19% |
|
||||||
|
Trig
<
150 |
85 |
70 |
82 |
- 4% |
|
||||||
|
Chol
³ 220 |
235 |
210 |
216 |
- 8% |
|
||||||
|
Chol
<
220 |
184 |
178 |
185 |
no
D |
|
||||||
|
Albumin-U |
24 |
12 |
14 |
- 42% |
|
||||||
Vaccinum
myrtillus, the European Blueberry
Anthocyanidin
bioflavonoids - protect and repair vascular
wall connective tissues
A.
Promotes glycosaminoglycan synthesis
B.
Decreases capillary permeability - less leaky
C.
Relieves abnormal
intercellular edema fluid collection
D.
Decrease basement membrane thickness
Can
Bilberry favorably effect diabetic retinopathy?
Bilberry
fruit extract standardized to 25% anthocyanosides
©
40
diabetic patients, 37 with retinopathy
·
160 mg or
placebo b.i.d. for four weeks
·
Double
blind, crossover protocol
Of
the patients with retinal abnormalities on eye exam
·
None
improved on placebo
·
79%
improved on bilberry
Of
the patients with abnormal fluorescin angiograms
·
None
improved on placebo
·
86%
showed mod. to sig. improvement on bilberry
BIOTIN
- NOT JUST FOR EGG SUCKERS
Available
in diet and manufactured by gut microflora
Avidin,
present in egg white, can inactivate biotin
Þ Biotin deficiency occurs only in egg suckers
Biotin
is critical to intracellular glucose metabolism
Low
biotin ®
glucose metabolites build up
® intracellular glucose builds up
® glucose spills out into circulation
®
diabetes mellitus
Feed
egg white to rats ® biotin deficient ® diabetic
Can
humans become biotin deficient?
Could
biotin deficiency cause some diabetes?
Will
biotin supplements help with sugar control?
©
43 middle
age patients with DM II of 5 years duration
·
All on
diet and glyburide
·
All with
poor diabetic control
·
Average
FBS 170 mg/dl
·
Abnormal
glucose tolerance test
·
64 age
matched healthy control subjects
¨
Average
biotin level was 41% lower in the diabetics
56.7 vs. 96.8 nmol/L in controls
¨
Biotin level was inversely related to the FBS
©
Hold
glyburide for 4 weeks in 28 patients
·
18
randomly selected to take biotin 3 mg t.i.d.
·
10
receive placebo t.i.d.
|
|
0
wks |
4
wks |
%
D |
|
Glucose |
231 |
127 |
-
45% |
|
Pyruvate |
107.4 |
63.8 |
- 40% |
|
Lactate |
2.32 |
1.25 |
- 46% |
|
·
Diet maintained, glyburide discontinued ·
Biotin 3 mg t.i.d. plus Clostridium butylium ·
Two to four year follow-up |
|
Results
·
FBS
normal in two months · Insulin level unchanged · Body weight unchanged · No side effects |
©
5
patients - no response to 1yr of glyburide 10 mg
·
Add
biotin 3 mg t.i.d. to drug therapy
© FBS
fell
© Insulin level unchanged
|
Can biotin help with diabetic neuropathy? ©
Three
patients with severe neuropathy · Biotin 10 mg/day IM for 6 weeks, then 10 mg/day IM M, W, & F for 6 weeks, then 5 mg/day orally for 1-2 years ¨ Within 4 to 8 weeks painful muscle cramps, tingling, and ability to walk improved; restless leg syndrome resolved |
©
13insulin
dependent diabetics
·
Measure
plasma biotin levels
·
Correlate
with the level of glucose control
·
Hold
insulin for one week, and treat with
¨
Biotin 16
mg/day, or
¨
Placebo
© FBS and Biotin
© FBS rose on placebo
© FBS fell from 266 to 126 on Biotin
BIOTIN -
CONCLUSIONS
1.
Biotin is necessary for intracellular glucose metabolism
2.
Biotin deficiency is common in diabetics
3.
Biotin deficiency compromises sugar control
4. Drug resistance may be due to biotin deficiency
5. Supplementation enhances the response to oral therapy
6. Supplementation alone improves diabetic control
7. Biotin may also help relieve symptoms of neuropathy
GLYCOSAMINOGLYCANS
Microalbuminuria
- albumin wastage by the kidney
·
Early
sign of diabetic nephropathy
·
Predicts
cardiovascular mortality
Due
to microvascular disease in the kidney
·
Oxidative
attack on the capillaries
·
Glycosylation
of vascular wall proteins
·
Decreased
production of heparan sulfate
·
Thickening
of the capillary basement membrane
©
12 middle
age, hypertensive, DM II patients
·
Standard
diet and insulin therapy maintained
·
Placebo
controlled cross-over study
·
6 -
sulodexide 100 mg/day ´ 4 months, then placebo
·
6 -
placebo ´ 4 months, then sulodexide
|
|
FBS |
HbA1c |
Fibrinogen |
|||
|
|
Start |
4
mos |
Start |
4
mos |
Start |
4
mos |
|
Placebo |
210 |
161 |
7.9 |
8.8 |
463 |
428 |
|
Sulodexide |
172 |
125 |
7.6 |
7.2 |
466 |
247 |
Microalbuminuria
(mg/min)
|
|
Baseline |
4
Months |
8
Months |
|
Placebo/Sulo |
120 |
220 |
44 |
|
Sulo/Placebo |
135 |
36 |
44 |
BP
over 4 months
Plac
155/81 - 157/82
Sulo
155/81 - 144/74
GLYCOSAMINOGLYCANS
1.
Tone up the function of the vascular wall
2.
Supplementation safe and well tolerated
3.
Modest effect on blood sugar control
4.
Beneficial effect on blood pressure
5.
Marked reduction in fibrinogen
6.
Reverse microalbuminuria
CHROMIUM
·
Necessary
co-factor for insulin function
·
90%
Americans are chromium deficient
·
Diabetics
need more chromium than do normals
·
American
diabetics will be chromium deficient
·
Could
chromium improve blood sugar control?
©
US-China
Chromium Study - 180 DM II patients
·
Usual
diet and medications were continued
·
Four
month intervention
¨
60
received placebo b.i.d.
¨
60
chromium picolinate 100 mcg b.i.d.
¨
60
chromium picolinate 500 mcg b.i.d.
| At 4 months | Placebo | 200 mcg | 1000 mcg | Decreased by |
| FBS | 158 | 135 | 127 | 20% |
| 2 hr sugar | 221 | 224 | 188 | 15% |
| HbA1c | 8.5 | 7.5 | 6.6 | 22% |
THE
CHROMIUM - NIACIN CONNECTION
· In animal studies, the response to chromium is uniform;
all diabetic or chromium deficient animals improve
· In human studies the response is non-uniform;
some subjects do not respond to chromium alone
· Remember that Glucose Tolerance Factor contains
chromium and niacin
©
Chromium
plus niacin vs. chromium or niacin alone:
Treatment
Response
200
mcg chromium chloride
No change in blood sugar
100
mg niacin
No
effect
Chromium
+ niacin
FBS ¯
7% from 96 to 89
15% ¯ in blood sugar
rise
following a meal
· Diabetics have difficulty synthesizing GTF from
chromium and niacin.
·
Therefore,
co-administration of niacin , 10 mg for every 100 mcg chromium, is appropriate in diabetics
·
Chromium
deficiency causes/aggravates diabetes
·
Chromium
deficiency is common in Americans
·
Chromium
supplementation improves insulin sensitivity
·
Diabetes
is common during pregnancy
·
Mother
Nature robs the mother to nourish the baby
·
Chromium
depletion occurs during pregnancy
·
Lab
breeder rats all become progressively diabetic
Is
chromium deficiency playing a role in
Could
supplementation help?
CHROMIUM
vs. GESTATIONAL DIABETES
©
30 women
with gestational diabetes
·
20-24th
week of pregnancy
·
All with
abnormal glucose-insulin tolerance tests
1.
Dietary change initiated
2.
Insulin added if diet and study treatment ineffective
3.
Randomize to Chromium Picolinate or placebo
Needed
insulin
¨ 4 mcg/kg, »
200 mcg
3
¨ 8 mcg/kg, »
400 mcg
1
¨ Placebo
4
4.
Repeat the glucose-insulin tolerance tests at 8 weeks
|
|
|
Placebo |
4
mcg/kg |
8
mcg/kg |
|
Fasting |
Glucose |
87 |
82 |
79 |
|
|
Insulin |
23 |
13 |
12 |
|
One
hour |
Glucose |
186 |
154 |
145 |
|
|
Insulin |
122 |
71 |
92 |
EFAs
IN DIABETIC NEUROPATHY
·
Prostaglandins
derived from GLA are important in nerve membrane structure, nerve blood flow,
and nerve conduction
·
Conversion
of dietary LA into GLA is defective in diabetics
·
Peripheral
neuropathy is a common complication of diabetes
In
diabetic animals, supplementation with GLA:
§ Restores abnormally reduced nerve blood flow;
prostacyclin ® nitric oxide Þ
vasodilation
§ Corrects the nerve conduction defect present
In
diabetic humans
§ Conversion of dietary fatty acids into the
essential
fatty acid precursors of the beneficial series 1
and
3 prostaglandins is impaired
§ Cell membrane omega-6 and omega-3 fatty acid
levels are reduced relative to non-diabetics
©
Three
studies of GLA in diabetic neuropathy - Twelve
500
mg Evening Primrose Oil capsules/day(480 mg GLA)
or
placebo; randomized, double-blind format
Six
physiological parameters; i.e. conduction velocity
Six
clinical measures; i.e. muscle strength and reflexes
Two
thermal indicators; i.e. ability to perceive temp D
Evaluate
upper and lower extremities Þ
28 parameters
©
GLA for six months in 22 patients - pilot study
All parameters improved in the GLA group
All parameters deteriorated in the placebo group
©
Multicenter study of GLA; 111 patients at 7 centers x 1 yr
25/28 parameters improved from baseline with GLA
26/28 parameters deteriorated in the placebo group
26/28 parameters did better with active treatment
©
2nd multicenter study of GLA; 293 patients at 10 centers
23/28 parameters improved from baseline with GLA
All 28 parameters deteriorated in the placebo group
27/28 parameters did better with active treatment
Side-effects similar in GLA and placebo groups
GYMNEMA SYLVESTRE
Woody
vine indigenous to Southern and Central India
Gurmar
in Hindi, meaning “sugar destroying”
Shustra,
a 6th centrury BC Ayurvedic, described the ability of gymnema leaf to
eliminate the sweet taste of sugar
Anti-diabetic
properties
1.
Decreases glucose absorption from the intestine
2.
Enhances insulin release from Beta cells
3.
May regenerate pancreatic Beta cells
4.
Beneficial in experimental diabetes
5.
Reduces sweet taste sensation for 90 minutes
6.
Crude herb may interfere with iron absorption
7.
GS4 standard extract used in medical applications
Will
Gymnema help with blood sugar control in humans?
©
75 type I
diabetics, age 10-50 years
·
38
received 200 mg GS4 b.i.d. and usual insulin
·
37
received their usual insulin alone
|
©
Effect on Insulin Release |
|||
|
C-Peptide |
Volunteers |
Insulin |
GS4 |
|
(.15-.34) |
.27 |
.11 |
.19 |
|
©
Effect on Sugar, Cholesterol, & Kidney Function |
|||||||
|
|
Insulin |
FBS |
HbA1c |
Chol |
Trig |
BUN |
|
|
Normal |
|
- |
89 |
6.0 |
179 |
90 |
24 |
|
Insulin |
Base |
55 |
233 |
12.7 |
225 |
124 |
22 |
|
|
1
yr |
55 |
224 |
11.8 |
209 |
112 |
22 |
|
|
%
D |
- |
- 4 |
- 7 |
- 7 |
- 10 |
- |
|
GS4 |
Base |
60 |
232 |
12.8 |
206 |
134 |
25 |
|
|
1.5yr |
35 |
150 |
9.0 |
194 |
120 |
19 |
|
|
2
yr |
25 |
152 |
8.5 |
176 |
107 |
18 |
|
|
%
D |
- 58 |
- 34 |
- 33 |
- 14 |
- 20 |
- 28 |
© Tolerance - Excellent; no side effects
©
47
middle-age type II diabetics,
·
25
receive their usual sulfonylurea
·
22 their
usual sulfonylurea & GS4 400 mg daily
|
© Fasting and Post-Prandial Insulin Levels |
|||||||
|
|
Fasting |
Post-Prandial |
|||||
|
Volunteers |
30 |
95 |
|||||
|
Usual
Therapy |
13 |
50 |
|||||
|
GS4
Group |
21 |
63 |
|||||
|
© FBS, Glycoprotein, & Lipid Values |
|||||||
|
|
|
FBS |
GlycoPrt |
Chol |
Trigs |
||
|
Usual |
Initial |
150 |
10.2 |
252 |
148 |
||
|
|
1
year |
157 |
10.5 |
261 |
164 |
||
|
|
%
D |
+ 5% |
+ 3% |
+ 4% |
+ 16% |
||
|
GS4 |
Initial |
174 |
12 |
260 |
170 |
||
|
|
1
year |
146 |
9.7 |
242 |
156 |
||
|
|
2
year |
124 |
8.5 |
231 |
142 |
||
|
|
%
D |
- 17% |
- 30% |
- 11% |
- 16% |
||
©
Tolerance -
Excellent
· No side effects
· Sense of well being and alertness improved
· Meds decreased; fully discontinued in 23%
Conclusions
In
type II diabetics and type I diabetics with some residual pancreatic function,
the GS4 Gymnema sylvestre preparation will:
1.
Promote insulin
release
2.
Lower fasting
blood sugar and HbA1c
3.
Decrease protein
glycosylation
4.
Lower
cholesterol and triglyceride level
5.
Decrease insulin
and sulfonylurea requirements
6. Without side effects and treatment cost is low
VITAMIN
E
Fact:
Vitamin E is of proven value in CV disease
·
Biological
oxidation initiates and aggravates vascular dz
·
We are
deficient in E and other antioxidants
·
E
supplementation prevents and stabilizes vascular dz
Fact:
DM, like vascular dz, is common in the US
·
Both
diseases are associated with aging
·
Oxidative
stress will compromise sugar control
¨
Impairs
cellular utilization of glucose
¨
Produces
a state of relative insulin resistance
· Insulin resistance is seen with “normal” aging
·
Insulin
resistance is frequently seen in coronary patients
·
The
leading cause of death in diabetics is vascular dz
Question:
Are oxidative stress, insulin resistance, diabetes,
and cardiovascular disease all intertwined?
Question:
Could Vit E be of therapeutic value in DM?
Could
Vitamin E:
·
Improve
blood sugar control?
·
Blunt
protein glycosylation?
·
Attenuate
the vascular consequences of DM?
· Help prevent diabetes?
© Effect of Vitamin E in diabetic and non-diabetics
·
10 healthy controls and 15 DM II patients
·
Vit E 900 mg/day or placebo for 4 months
·
Evaluate the effect of Vitamin E on:
¨
Vit E
level
¨ GSSG:GSH
¨
RBC
viscosity ¨ AUC on GTT
¨
Total
body glucose disposal rate
¨
Glucose
control parameters
·
Randomized, double blind, crossover protocol
Normal
Controls
|
|
Vitamin
E level |
GSSG: GSH |
RBC Viscosity |
AUC GTT |
TBGD |
|
Placebo |
2.5 |
.88 |
.224 |
344 |
39 |
|
Vit
E |
8.4 |
.64 |
.215 |
287 |
48 |
|
E
vs P |
+ 235% |
- 21% |
- 4% |
- 17% |
+ 23% |
Diabetic
Patients
|
|
Vitamin
E level |
GSSG: GSH |
RBC Viscosity |
TBGD |
|
Placebo |
.16 |
1.21 |
.245 |
19 |
|
Vit
E |
6.2 |
.65 |
.220 |
28 |
|
E
vs P |
+ 3000% |
- 46% |
- 10% |
+ 47% |
|
|
FBS |
2
hr sugar |
GTT-AUC |
HbA1c |
|
Placebo |
131 |
248 |
614 |
7.9 |
|
Vit
E |
120 |
226 |
514 |
7.0 |
|
E
vs P |
- 8% |
- 9% |
- 16% |
- 11% |
© Vitamin E in non-diabetic coronary patients
·
30
elderly, overweight patients with angina
·
Vit E 900
mg/day or placebo for four months
·
Evaluate
Vit E effects on glucose, insulin, lipids, rbc viscosity, & free radical
activity
·
Randomized,
double blind, crossover protocol
|
|
Vitamin
E |
O2
Radicals |
Microviscosity |
|
Placebo |
8.9 |
0.21 |
.283 |
|
Vit
E |
54.8 |
0.09 |
.231 |
|
E
vs. P |
+ 515 % |
- 57 % |
- 19 % |
|
|
Glucose |
Insulin |
|
||||
|
|
Fast |
2
hr |
%
D |
Fast |
2
hr |
%
D |
|
|
Placebo |
102 |
131 |
+28 % |
8.8 |
34.8 |
+338 % |
|
|
Vit
E |
102 |
125 |
+22 % |
6.8 |
26.3 |
+348 % |
|
|
|
Chol |
LDL |
HDL |
Trigs |
LDL:HDL |
|
Placebo |
269 |
231 |
30 |
119 |
7.6 |
|
Vit
E |
233 |
191 |
34 |
95 |
5.5 |
|
E
vs. P |
- 12 % |
- 17 % |
+ 13 % |
- 20 % |
- 27 % |
© Vitamin E and protein glycosylation
·
Non-Enzymatic
Protein Glycosylation - NEG
¨
Sugar + Protein +
Heat = Glycosylated Protein
¨
Browning rxn in cooking & food processing
¨
Maillard reaction in chemistry
¨
HbA1c and glycosylated protein levels
¨
Predictive of diabetic complications
·
Antioxidants
block the Browning reaction
·
Vitamin E
blocks the Maillard reaction
·
Could E
block protein glycosylation in diabetics?
©
30
insulin dependent diabetic adults
·
Insulin
& standard diet continued in all
·
Four
months of intervention
¨10 received placebo
¨ 600
mg/day Vit E in 10
¨1200 mg/day Vit E in 10
·
Look for
an E effect on protein glycosylation
|
|
E
level |
Gluc |
HbA1c |
GlycProt |
|
Placebo |
9.8 |
185 |
1.2 |
1.8 |
|
E
600 mg |
21.4 |
190 |
.83 |
1.4 |
|
E
1200 mg |
31.2 |
187 |
.48 |
1.2 |
VITAMIN E
AND FUTURE DIABETIC RISK
In
Finland vs. Europe
·
Dietary
Vit E intake is low: 60% <
10 mg RDA
·
Average E
level 19 mmol/L vs 26 elsewhere
· Prevalence of DM II is higher and rising
Could
the Finn’s low Vit E status be playing a role?
©
1000 healthy Finnish men age 42-60
·
Non-diabetic:
FBS <
120; 2 hr sugar < 180
·
Measure
Vit E level and other parameters
·
Evaluate
for DM II four years later
|
Risk
Factor for DM II |
Rel.
Risk |
|
No
increased risk |
1.0 |
|
Smoking
|
1.015 |
|
Age |
1.02 |
|
Socioeconomic
status |
1.1 |
|
High
Sat:Unsat fat ratio |
1.1 |
|
Body
mass index |
1.23 |
|
Below
median Vit E |
3.9 |
5% decrease in Vit E Þ 22% increase in risk
VITAMIN
E - CONCLUSIONS
VITAMIN
E in DM, INSULIN RESISTANCE, & CADz
©
Healthy,
non-diabetic adults without coronary disease
·
Reduces
oxidative stress
·
Enhances
cellular glucose utilization
·
Attenuates
insulin resistance
·
Protects
against diabetes
©
Non-diabetic
adults with coronary disease
·
Reduces
oxidative stress
·
Enhances
cellular glucose utilization
·
Attenuates
insulin resistance
·
¯es Chol, LDL, Trigs and es HDL
©
Diabetic
patients
·
Are
relatively deficient in Vitamin E
·
Experience
greater oxidative stress
·
Supplemental
E will:
¨
Resolve
the oxidative stress
¨
Improve
cell membrane viscosity and function
¨
Reduce
insulin resistance, enhance cellular glucose uptake, and improve diabetic
control
¨ Blunt abnormal protein glycosylation
VITAMIN
C
GLUCOSE
VITAMIN C
 H ¾ C = O
O ¾ C ¾¾
H ¾ C = O
O ¾ C ¾¾
½
½
H ¾ C ¾ OH
OH ¾
C
½
½
O
HO ¾ C ¾ H
OH ¾
C
½
½
H
¾ C ¾ OH
H ¾ C ¾¾
½
½
H ¾ C ¾ OH
HO ¾
C
½ ½
CH2OH
CH2OH
·
Functions
of Vitamin C:
¨
Formation of collagen ¨
Antioxidant
¨
Protein synthesis
¨
Immune system
·
Vitamin C and glucose are structurally similar
· Insulin facilitates the transfer of vitamin C into cells
Þ
Diabetics are C & intracellular C deficient
|
|
Intake |
Vit
C level |
|
Controls |
70
mg |
68
mmol/L |
|
Diabetics |
61
mg |
30
mmol/L |
· C blunts protein glycosylation & sorbitol production
· Low intracellular C is a secondary nutritional deficiency that promotes the complications of DM
·
This
intracellular C deficiency is reversible
Will supplementation be of value?
VITAMIN
C & PROTEIN GLYCOSYLATION
©
12
healthy non-diabetic subjects
·
Vitamin C
1000 mg/day
·
No change
in diet
·
Labs at
baseline and three months
¨
No change in fasting glucose or insulin
¨
Plasma
and RBC vitamin C levels
|
|
Plasma
C |
RBC
C |
Plasma:RBC |
|
Baseline |
73 |
60 |
1.26 |
|
Supplementation |
|
|
|
|
1
month |
109 |
59 |
1.92 |
|
2
months |
119 |
74 |
1.55 |
|
3
months |
93 |
84 |
1.14 |
|
|
|
|
|
|
Off
C ´ 1 month |
59 |
43 |
1.26 |
VITAMIN
C & SORBITOL FORMATION
Intracellular
Sorbitol Accumulation
Aldose
Reductase Polyol
Dehydrogenase
Glucose
------------------> Sorbitol ----------------------> Fructose
¨ Retina & Lens
¨ Peripheral nerve
¨
Kidney ¨
RBC
· Vitamin C and glucose are structurally similar
· Compete for biochemical attention
· C transport into cells is insulin dependent
· C transport is compromised by high glucose
·
Diabetics
are C and intracellular C deficient
·
Intracellular
sorbitol predicts complications
Can
we raise intracellular C with supplements?
Will this lower intracellular sorbitol?
VITAMIN
C & SORBITOL FORMATION
©
In healthy volunteers
· Measure rbc vitamin C & sorbitol levels
· Supplement for 2 weeks with
¨
Vitamin C 500 mg
¨
C 500 mg with citrus bioflavonoids
¨
Vitamin C 2000 mg
· Repeat the rbc measurements
|
|
RBC
Vitamin C |
RBC
Sorbitol |
||||
|
|
Base |
Tnt |
% D |
Base |
Tnt |
% D |
|
C 500 mg |
33 |
45 |
+35 |
20 |
17 |
-13 |
|
C 500 & BF |
32 |
49 |
+58 |
20 |
14 |
-27 |
|
C 2000 mg |
33 |
130 |
+291 |
19 |
8 |
-58 |
© Type I and II diabetic patients
|
|
Vitamin
C |
RBC
Sorbitol |
|
|
||||||
|
|
Base |
Tnt |
% D |
Base |
Tnt |
% D |
|
|||
|
C 2000 mg |
32 |
54 |
+68 |
50 |
26 |
-68 |
|
|||
|
2000 & BF |
35 |
56 |
+60 |
52 |
31 |
-40 |
|
|||
VITAMIN
C & SUGAR CONTROL
©
27 type
II diabetic patients under medical therapy
· 90 day run in period
· Vitamin C 1000 mg b.i.d. for 90 days
·
Usual diet,
insulin, and drugs continued
· Randomized, double blind protocol followed
|
|
FBS |
HbA1c |
Chol |
HDL |
Trigs |
|
Run
in |
181 |
9.3 |
239 |
44.7 |
221 |
|
Vit
C |
163 |
8.5 |
228 |
42.4 |
195 |
|
%
D |
- 10% |
- 9% |
- 5% |
- 5% |
- 12% |
VITAMIN
C - Summary
1.
Vitamin C metabolism is abnormal in diabetics
2.
Diabetics are vitamin C deficient
3.
C is involved in glucose metabolism
4.
Vitamin C supplementation will:
¨
Increase intracellular C levels
¨
Modestly improve glucose control
¨
Decrease protein glycosylation
¨
Block intracellular sorbitol accumulation
VITAMIN
B12 VS RETINOPATHY
©
37
teenage type I diabetic patients
·
15
received 100 g/day B12 with their insulin
·
22
received insulin alone
·
Same diet and insulin dosages
·
Evaluate retinopathy at baseline, 1, & 2 years
|
|
B12
Treated |
Controls |
||
|
Retinopathy
|
Yes |
No |
Yes
|
No |
|
Pre-
B12 |
15 |
0 |
8 |
14 |
|
DM
duration |
12 |
- |
8.5 |
7.6 |
|
1
year B12 |
8 |
7 |
7 |
15 |
|
DM
duration |
14 |
12 |
9.7 |
8.5 |
|
2
years B12 |
7 |
8 |
10 |
12 |
|
DM
duration |
14 |
14 |
10 |
10 |
VITAMIN
B12 VS NEUROPATHY
· B12 is necessary for normal nerve function
·
Deficiency produces a reversible neuropathy
·
B12 metabolism is deranged in diabetics
©
12
diabetics with severe neuropathy
·
Classic
pain and numbness
· Decreased
DTRs and vibratory perception
·
Disordered
balance
¨ 15-30
g/day
for 1-2 weeks & 1-2/week to follow
¨
Saline
injections given to some ® no effect
¨
Glucose
adequately controlled
|
Complete
remission |
4 |
Improved |
3 |
|
Near
complete |
3 |
Questionable
|
2 |
·
The
majority had gastric hypochlorhydria
·
Constipation
and diarrhea tended to improve
· Impotence in two men resolved
LITHIUM
·
Used in
the treatment of manic-depressive illnesses
· Hypoglycemic reactions have been noted
·
Lithium
deficiency present in some animal models
·
Insulinomimetic
properties noted
Could
lithium help with blood sugar control in diabetics?
© Initially used to treat DM in 1924
©
33 type II and 5 type I diabetic patients
· Admit to a metabolic ward and stabilize sugars
· Hold diet and treatments constant
· Add lithium carbonate 100 mg/day to their regimen
· FBS and 1 hour PP at baseline & two weeks
|
|
Fasting
Blood Sugar |
One
Hour Post-Prandial |
||||
|
|
Base |
2
wks |
%
D |
Base |
2
wks |
%
D |
|
Diet |
137 |
128 |
- 6% |
274 |
184 |
- 33% |
|
Pills |
157 |
108 |
- 31% |
220 |
178 |
- 19% |
|
Insulin |
195 |
122 |
- 38% |
223 |
164 |
- 26% |
·
Tolerance
good-transient thirst the first few days; liver,
kidney, and lung function unchanged.
·
Some
variability in response
· Insulin requirement decreased in 50%
TAURINE
·
Amino
acid present in animal food sources
· Most abundant amino acid in heart muscle
¨ Taurine is effective in CHF
· Taurine is an integral component of blood platelets
¨ Taurine decreases platelet stickiness in
normals
¨ Potentiates the effect of aspirin and other
agents
·
Taurine
may interact with insulin receptors
¨
Platelet function is abnormal in diabetics
¨
Plays a role in diabetic vascular complications
Could
Taurine improve platelet function in diabetics?
©
39 type I
diabetics
·
All well
controlled; none with HTN or CV dz
·
Measure
Taurine levels and platelet indices
·
500 mg
Taurine t.i.d. for 90 days
·
Repeat
lab studies
·
Obtain
same labs from 34 control subjects
|
|
Taurine |
Plt
Taurine |
Arachacid
50 |
|
Controls |
127 |
.99 |
.72 |
|
Diabetics
pre |
66 |
.66 |
.44 |
|
Diabetics
post |
93 |
.99 |
.72 |
ARGININE
Nitric Oxide Synthase
Arginine ---------------------->
Nitric Oxide
©
Natural Vasodilator
©
Vasoprotective
©
Antioxidant
©
Antithrombotic
Insulin,
our metabolic hormone, is also a vasodilator
·
Insulin levels rise following a meal
·
Releases nitric oxide in arteries to muscle
·
Takes sugar & insulin to the cells that need them
Insulin
mediated vasodilation is impaired in DM II
·
Arginine transport is insulin dependent
·
Arginine is required to make nitric oxide
·
Nitric oxide is required for the vasodilation
Is
intracellular arginine deficiency the culprit?
Will
arginine restore insulin mediated vasodilation?
Could
arginine protect vs vascular complications?
ARGININE
Arginine
responsive cardiac conditions
·
Effort angina
·
Vasospastic angina
·
Hypertension ·
Heart failure
· Microvascular ischemia
·
Endothelial dysfunction
©
Trim & obese volunteers and type II diabetics
·
Measure insulin mediated vasodilation
·
Measure overall insulin sensitivity
·
Repeat during arginine supplementation
|
©
Change in blood flow |
||
|
|
Base |
Arg. |
|
Trim |
+21% |
+
25% |
|
Obese |
+ 2% |
+
22% |
|
DM II |
- 1% |
+
22% |
|
© D
in Insulin sensitivity |
||
|
|
Base |
% |
|
Trim |
4.3-3.4 |
21% |
|
Obese |
9.7-7.8 |
19% |
|
DM II |
13.7-11 |
16% |
VANADIUM
·
Essential
trace element
¨
Widely
distributed in nature
¨
Readily
available in the food supply
¨
Necessary
for proper cellular function
·
Insulinomimetic
properties
¨
Promotes
glucose uptake, utilization for energy,
or
storage as glycogen in muscle & liver cells
¨
Effective
in experimental diabetes
Could
Vanadium help control diabetes in humans?
©
Dr.
Lyonne thought so in 1899
©
Overweight
type II diabetic and non-diabetic individuals
·
2 wks
placebo, then 3 vanadyl sulfate 50 mg bid
·
Diet and
other therapies held constant
·
Labs
before and after each treatment
|
|
Controls |
Diabetics |
|||
|
|
Placebo |
VS |
Plac |
VS |
%
D |
|
FBS |
97 |
100 |
220 |
190 |
- 14% |
|
HbA1c |
<
6.2 |
<
6.2 |
9.4 |
8.8 |
- 6% |
|
Chol |
191 |
196 |
203 |
191 |
- 6% |
|
Trig |
333 |
410 |
626 |
498 |
- 14% |
VEGAN
DIET for NEUROPATHY
·
Weimar
Institute in California
·
25 day
intensive in-house program of nutritional intervention, vegan diet, and
life-style modification
Effect
in 21 diabetic patients
©
Burning pain resolved in 17/21, on average at
10 days(4-15); partial or slight improvement in 4
© Numbness noticeably improved at 25 days
©
FBS
decreased from 168 to 115
©
Cholesterol
fell by 13%, triglycerides by 25%
©
11 on
insulin pre-diet
¨
Dose
decreased in 9
¨
Insulin
stopped in 2
©
7 on sulfonylureas pre-diet
¨
3
converted to insulin
¨
Dose
decreased in 2
¨ Discontinued in 2
MANGANESE
·
Co-factor
in enzyme systems involved in sugar control,
energy
metabolism, and thyroid hormone function
·
Manganese
depletion leads to diabetes in animals
·
Diabetic
humans have ½ the level of non-diabetics
· 30 mg/day is recommended
ZINC
·
Critical
to multiple steps in glucose metabolism
Insulin synthesis, storage, and release
¨ Insulin binding to liver, muscle, and fat
cells
¨ Intracellular glucose metabolism
·
Experimental
zinc deficiency ®
diabetes
¨ Insulin release and binding reduced
¨ Impaired wound healing - reversible
·
Human
zinc deficiency ®
¯ insulin and
glucose
·
American
diabetics are zinc deficient
¨ 2/3rds of us take in < 2/3rds of the zinc RDA
¨ Diabetics waste zinc in the urine
¨ Zinc wastage »
severity of the diabetes
¨ Average level 65 vs 87mg/dl; 25% deficient
¨ Pancreatic zinc content 50% of non-diabetics
© Supplementing poorly controlled diabetics
|
|
Diet |
Diet
+ 28 mg Zn |
||
|
|
Before |
After |
Before |
After |
|
Zinc
mg/dl |
54 |
54 |
48 |
63 |
|
FBS
mg/dl |
212 |
218 |
233 |
202 |
POTASSIUM
·
Render rats potassium deficient ®
¨ Glucose levels rise
¨ Insulin levels fall
·
Obese non-diabetics on a protein sparing fast ®
¨ Glucose utilization decreases
¨ Insulin levels fall
·
Supplement potassium during the fast ®
¨ Normal glucose and insulin metabolism
·
Thiazide
diuretics - HCTZ & dyazide
¨
glucose level in diabetics
¨ Induce
hyperglycemia in non-diabetics
Why?
©
Non-diabetic healthy volunteers
·
Measure K+
level and insulin function
·
HCTZ 100 mg/day ´ 10 days
¨
With KCL 80 meq/day
¨
Without KCL supplementation
·
Repeat the measurements
|
|
80
meq KCL |
No
KCL |
|
K+
pre |
3.85 |
3.85 |
|
K+
post |
4.35 |
3.05 |
|
FBS
pre |
92 |
93 |
|
FBS
post |
Nl |
Nl |
|
Glucose
tolerance |
Nl |
Reduced |
|
Insulin
release |
Nl
|
¯ by 20% |
MAGNESIUM
·
Second most abundant intracellular mineral
¨ Critical to energy formation
¨ Necessary for proper insulin function
·
Abundant in a natural diet
¨ Lost in food processing
¨ 85% take in <
the RDA of 350 mg
·
Diabetics waste Mg+2
through the kidney
¨ Mg+2
deficiency is 2° the Diabetes
¨ ³
25% diabetics are hypomagnesemic
·
Mg+2
deficiency causes/aggravates insulin resistance
¨
Mg+2
deficiency is a cause of diabetes
¨
DM 1/µ drinking water magnesium
· Low
Mg+2
is
associated with diabetic complications
¨
Retinopathy
¨ CV disease
¨
Platelet dysfunction ¨
Hypertension
|
Group |
Magnesium |
|
Healthy volunteers |
1.04 |
|
DM without retinopathy |
0.88 |
|
DM - nonproliferative retinopathy |
0.77 |
|
DM - proliferative retinopathy |
0.66 |
1. Is magnesium repletion possible in diabetics? Yes
2. Will this effect diabetic complications? Yes
·
Platelet
function · Hypertension
·
Lipids
· Overall
CV risk
3. Will Mg+2
favorably
effect insulin release?
4. Will Mg+2
favorably
effect insulin sensitivity?
©
Overweight
type II diabetic patients
· 3 week run-in: Stable diet, all drugs on hold
· Baseline labs
· Magnesium 2 gm/day or placebo ´ 3 weeks
·
Two week
washout period
·
Crossover
to the other treatment
·
Repeat
labs at the end of each treatment period
|
|
Washout |
Placebo |
Magnesium |
|
Plasma
Mg |
.79 |
.78 |
.86 |
|
RBC
Mg |
1.86 |
1.88 |
2.03 |
|
Insulin |
9 |
9 |
10 |
|
Glucose |
161 |
157 |
145 |
NICOTINAMIDE
Pathogenesis
of type I diabetes
1.
Viral or toxic damage to the b cells
2.
Followed by auto-immune attack
3.
Free radical oxidation is involved
Could
an antioxidant, administered at diagnosis, prevent or delay progression to full
blown DM?
Could
an antioxidant, given to children at high risk, prevent the development of DM?
Nicotinamide
·
Protects islet cells from oxidative damage
·
Converts into NAD, a cellular repairer
·
Promotes b cell regeneration in vitro
·
Prevents/delays experimental DM
©
16 patients with newly diagnosed DM I
·
Intensive
insulin therapy initiated
·
At one
week add
¨ Placebo or
¨ Nicotinamide 3,000 mg/day
·
Adjust insulin as required
·
Randomized, double blind protocol
|
|
Base |
6
months |
12
months |
||||
|
|
A1c |
off
I |
U/kg |
A1c |
off
I |
U/kg |
A1c |
|
Placebo |
14.9 |
22% |
.22 |
7.7 |
0% |
.35 |
8.6 |
|
Nicot. |
14.4 |
71% |
.07 |
7 |
43% |
.23 |
6.4 |
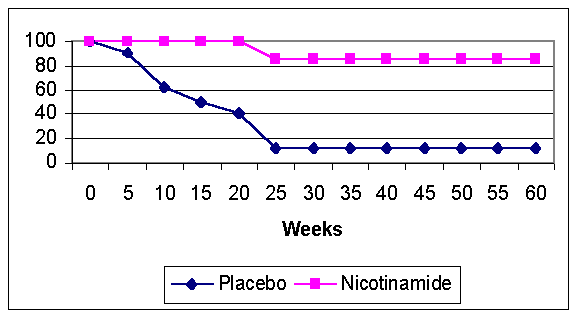
© Meta analysis of 10 randomized studies
|
|
Diagnosis |
6
months |
12
months |
|||
|
|
Ctrls |
Nicot |
Ctrls |
Nicot |
Ctrls |
Nicot |
|
C-pep |
.62 |
.50 |
.47 |
.76 |
.32 |
.73 |
|
Insulin |
.52 |
.50 |
.44 |
.43 |
.50 |
.49 |
|
HbA1c |
12.9 |
12.5 |
7.2 |
6.5 |
6.3 |
6.2 |
©
Preventing type I diabetes in New Zealand
·
Screen 5-7 year olds for islet cell antibodies
¨
32,000 offered testing
§
20,000 underwent testing
ª
150 were Islet Cell Antibody positive
1,000 mg/day
nicotinamide begun
§
12,000 declined testing
¨
48,000 not offered testing
|
Group |
#
DM/10,000 kids/year |
|
20,000
-150 treated |
8.1 |
|
12,000
declined screening |
15.1 |
|
48,000
not screened |
20.1 |
·
High ICA
level precedes DM I by several years
·
With a
diabetic 1st degree relative Þ
diabetes
inevitable
·
FPIR
steadily declines » loss of b-cell
function
Can
Nicotinamide prevent or delay progression
to
diabetes in high risk children?
·
Screen
kids with a 1st degree diabetic relative
¨
562 children in Denver; 1500 in Aukland
¨
High level of ICA - Islet Cell Antibodies
¨
Still normal HbA1c
¨
FPIR below the 5th %ile
Þ
Not diabetic but progression inevitable
·
1st
8 in Denver were observed as a control group
·
Denver
kids 9-12 and all 10 Aukland kids received nicotinamide 1500-3000 mg/day
·
Monitor
both groups for progression to DM I
|
Untreated
control group |
||
|
Age |
FPIR |
Months
to DM |
|
6 |
4 |
4 |
|
13 |
15 |
3 |
|
4 |
29 |
14 |
|
6 |
35 |
21 |
|
15 |
37 |
21 |
|
5 |
39 |
4 |
|
7 |
43 |
57 |
|
15 |
47 |
11 |
|
Mean
9 |
31 |
17 |
|
Nicotinamide
group |
||||
|
Age |
FPIR |
Tnt-mos |
FPIR-1
yr |
FPIR-2
yr |
|
10 |
3 |
25
- DM |
0 |
7 |
|
4 |
12 |
24 |
32 |
- |
|
10 |
14 |
2 |
- |
- |
|
6 |
15 |
17 |
14 |
- |
|
8 |
21 |
18 |
18 |
- |
|
12 |
24 |
26 |
35 |
24 |
|
2 |
26 |
5 |
- |
- |
|
6 |
27 |
6 |
- |
- |
|
8 |
39 |
13 |
- |
- |
|
6 |
43 |
11 |
- |
- |
|
1 |
44 |
12 |
- |
- |
|
3 |
47 |
27 |
79 |
128 |
|
5 |
56 |
26 |
98 |
72 |
|
8 |
66 |
30 |
83 |
- |
|
Mean
6 |
31 |
17 |
|
|
Rate
of progression to full diabetes
|
|
Control |
Nicotinamide |
|
At
one year |
4/8 |
0/9 |
|
At
two years |
7/8 |
0/6 |
Probability
of remaining non-diabetic
NICOTINAMIDE
·
Prevents/delays
pancreatic failure in type I DM
· Preserve insulin release from the failing pancreas
Could
Nicotinamide preserve insulin release and prevent/delay pancreatic failure in
type II DM ?
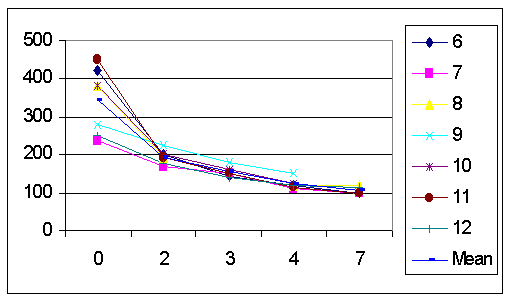
©
18
patients with poorly controlled type II DM
·
High
sugar despite max dose sulfonylurea therapy
· All on diet; none on insulin
·
All with
normal body weight
¨
Measure FBS, MBS, HbA1c, and C-Peptide
¨
Randomly
divide into three groups:
§ Insulin
plus Nicotinamide 500 mg tid
§ Insulin
plus Placebo tid
§ Current
SU plus Nicotinamide 500 mg tid
¨
Repeat measurements at three and six months
¨
Patients blinded re Nicotinamide vs Placebo
Nicotinamide
- Physiologic properties
·
Protects islet cells from oxidative damage
·
Converts into NAD, a cellular repairer
·
Promotes b cell regeneration in vitro
·
Prevents/delays experimental DM
Clinical
Effects
·
Prevents or delays pancreatic failure &
progression to insulin dependent type I DM in
¨
Children with Islet Cell Antibodies
¨ Children with ICAs and impaired FPIR
·
Delays & may reverse the disease in
¨ Children with recently diagnosed type I DM
·
Preserves pancreatic function and synergizes
with insulin and sulfonylurea drugs in
¨
DM II failing sulfonylurea therapy
BITTER
MELON
·
World wide 80% of diabetes care remains herbal
·
Mormodica charantia - centuries of traditional use
¨
Anti-viral proteins - momorcharin & charantin
¨
b-sitosterol & diosgenin
¨
Insulin-like polypeptide
©
Vegetable insulin therapy for diabetics
·
All medications held for 24 hours
·
Draw fasting blood sugar
·
Subcutaneous injection
¨
Saline - 5 healthy volunteers
¨
Saline - 5 diabetic controls
¨
Vegetable insulin - 9 diabetic subjects
·
All subjects remained fasting
·
Measure sugar values throughout the day
|
|
0 |
.5 |
1 |
1.5 |
4 |
6 |
8 |
12 |
|
Controls |
75 |
71 |
71 |
71 |
71 |
71 |
71 |
71 |
|
DM-Saline |
210 |
200 |
200 |
199 |
198 |
199 |
198 |
198 |
|
DM-Insulin |
295 |
232 |
222 |
206 |
150 |
176 |
189 |
210 |
|
|
· Onset of hypoglycemic activity - ½ to 1 hour
· Peak effect
¨ 4 hours in type I diabetics
¨ 6 hours in type II patients
BITTER
MELON
©
12 type II diabetic patients
·
Stable but elevated sugars on a diabetic diet
·
Treat with Bitter Melon fruit
¨
Five with 5 gm powder tid » 100 mg ´
3 wks
¨
Seven get aqueous extract of 100 mg ´
7wks
·
Measure post-prandial sugar at various points
·
Monitor for liver, kidney, or CBC side-effects
·
Monitor symptoms - Thirst, weakness, burning
Results
§
Symptoms improved & no side-effects
§
Post-prandial sugar at 3 weeks
¨ ¯
by 25% - powder
¨ ¯
by 54% - aqueous extract
§
Glyco Hb ¯ by 17%, from 8.4 to 6.9
|
|
Post-Prandial
Sugar |
||||||
|
Pwdr |
Pre |
Post |
%
¯ |
Acq |
Pre |
Post |
%
¯ |
|
1 |
297 |
154 |
48 |
6 |
422 |
97 |
77 |
|
2 |
331 |
262 |
21 |
7 |
236 |
99 |
58 |
|
3 |
280 |
217 |
23 |
8 |
380 |
118 |
69 |
|
4 |
424 |
377 |
11 |
9 |
280 |
150 |
46 |
|
5 |
200 |
137 |
32 |
10 |
380 |
125 |
67 |
|
Mean |
306 |
229 |
25 |
11 |
450 |
100 |
78 |
|
|
|
|
|
12 |
250 |
115 |
54 |
|
|
|
|
|
Mean |
343 |
115 |
66 |
Fall
in sugar over time - aqueous extract
|
|
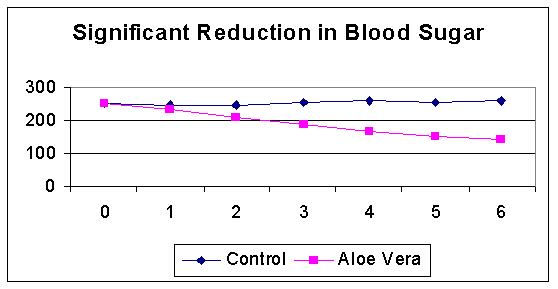
ALOE
VERA
Health
benefits of Aloe Vera - well documented
·
Anti-inflammatory and immune system stimulation
·
Lipid reduction in coronary patients
·
Anti-anginal properties
·
Said to be of value to diabetics
¨
Diabetics is a major problem in Thailand
¨
Rely on expensive imported drugs
¨
Aloe gel effective and safe in animal studies
¨
Flavored juice - 80% aloe vera gel extract
©
72 middle age type II diabetics
·
Elevated FBS and abnormal GTT
·
Otherwise good health
·
No prior diabetic treatment
¨ Divide into matched groups receiving:
·
One tablespoon juice bid, or
·
Sweetened placebo solution bid
¨ FBS & lipids at baseline and every 2 wks ´ 6 wks
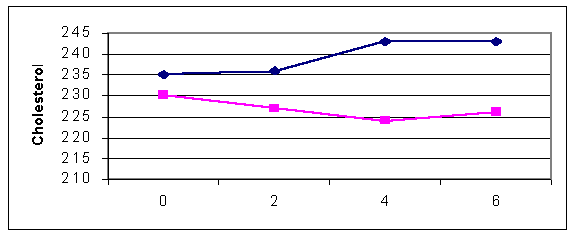
|
|
Is Aloe Vera additive to drug therapy?
©
72 middle age type II diabetics
·
Elevated FBS and abnormal GTT
·
All on 10 mg glibenclamide
¨
Divide
into matched groups receiving:
·
Glibenclamide and one tablespoon juice bid, or
·
Drug therapy and placebo juice bid
¨
FBS & lipids at baseline and every 2 wks ´
6 wks
Results
§
Well tolerated - no subjects dropped out
§
No effect on liver and kidney chemistries
§ Effect on sugar, cholesterol, and triglycerides
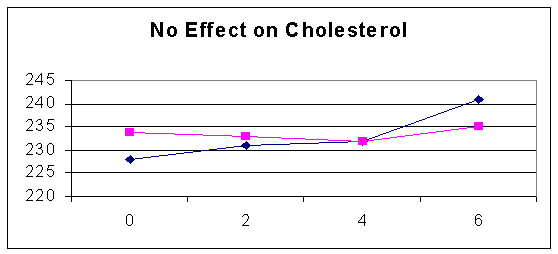
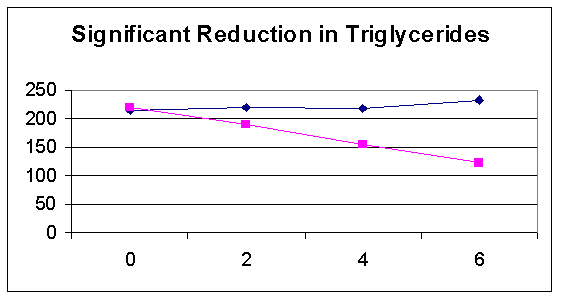
|
|

ALOE
VERA
Health
benefits of Aloe Vera - well documented
·
Anti-inflammatory and immune system stimulation
·
Lipid reduction in coronary patients
·
Anti-anginal properties
·
Said to be of value to diabetics
·
80% aloe gel flavored juice used in Thailand
Clinical
Effects
In
newly diagnosed or untreated type II diabetes:
¨
Significant
reduction in blood sugar
¨
Significant reduction in triglycerides
Type
II diabetes poorly controlled with sulfonylureas
¨ Significant reduction in blood sugar
¨ Significant reduction in triglycerides